New York's 24th congressional district
New York’s 24th congressional district is located in Upstate New York, stretching alongside Lake Ontario from near Buffalo in the west to Watertown in the east. The district does not include Rochester, which is in the 25th district. Since 2023, it has been represented by Claudia Tenney. In the 2022 election it voted more strongly Republican than any other district in the state. Prior to the redistricting which took effect in 2023, the district included the city of Syracuse.
| New York's 24th congressional district | |||
|---|---|---|---|
Interactive map of district boundaries since January 3, 2023 | |||
| Representative |
| ||
| Distribution |
| ||
| Population (2021) | 715,194 | ||
| Median household income | $64,197[1] | ||
| Ethnicity |
| ||
| Cook PVI | R+11[2] | ||
.svg.png.webp)

Voting
Results under current lines (since 2023)[3]
| Year | Office | Result |
|---|---|---|
| 2016 | President | Trump 57–36% |
| 2020 | President | Trump 57–40% |
History
- 1869–1873: All of Cayuga, Seneca, Wayne counties
- 1919–1945: Parts of Bronx and Westchester counties
- 1945–1971: Parts of Bronx county
- 1971–1973: Parts of Bronx and Westchester counties
- 1973–1983: Parts of Westchester county
- 1983–1993: All of Columbia, Greene, Saratoga, Warren and Washington counties; parts of Dutchess and Rensselaer counties
- 1993–2003: All of Clinton, Franklin, Fulton, Hamilton, Jefferson, Lewis, Oswego and St. Lawrence counties; parts of Essex and Herkimer counties
- 2003–2013: All of Chenango, Cortland, Herkimer and Seneca counties; parts of Broome, Cayuga, Oneida, Ontario, Otsego, Tioga and Tompkins counties
2013–2023
- All of Cayuga, Onondaga and Wayne counties; part of Oswego county
From 2013 to 2023, the district included all of Cayuga, Onondaga, and Wayne counties, and the western part of Oswego County. Its largest city was Syracuse, and it as a swing district.
This district was represented by Republican John Katko from 2015 to 2023. In the 117th United States Congress, it was one of very few Democratic-leaning districts in the country to be represented by a Republican, and one of only nine districts that voted for Joe Biden in the 2020 presidential election while being held or won by a Republican. Katko had also won re-election in 2016 while the district was carried by Democrat Hillary Clinton.
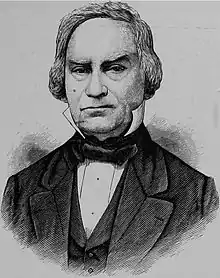
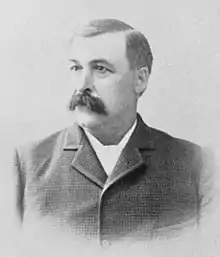
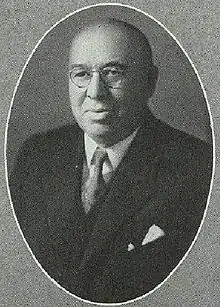
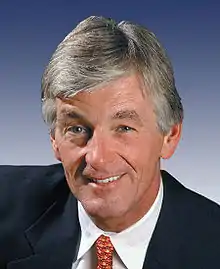
List of members representing the district




.jpg.webp)




.jpg.webp)








Election results
| Party | Candidate | Votes | % | ±% | |
|---|---|---|---|---|---|
| Republican | Gerald B.H. Solomon (incumbent) | 164,019 | 73.2 | ||
| Democratic | Edward James Bloch | 60,188 | 26.8 | ||
| Majority | 103,831 | 46.8 | |||
| Turnout | 224,207 | 100 | |||
| Party | Candidate | Votes | % | ±% | |
|---|---|---|---|---|---|
| Republican | John M. McHugh (incumbent) | 124,240 | 71.1 | ||
| Democratic | Donald Ravenscroft | 43,692 | 25.0 | ||
| Independence | William H. Beaumont | 6,750 | 3.9 | ||
| Majority | 80,548 | 46.1 | |||
| Turnout | 174,682 | 100 | |||
| Party | Candidate | Votes | % | ±% | |
|---|---|---|---|---|---|
| Republican | John M. McHugh (incumbent) | 116,682 | 79.0 | +7.9 | |
| Democratic | Neil P. Tallon | 31,011 | 21.0 | −4.0 | |
| Majority | 85,671 | 58.0 | +11.9 | ||
| Turnout | 147,693 | 100 | −15.5 | ||
| Party | Candidate | Votes | % | ±% | |
|---|---|---|---|---|---|
| Republican | John M. McHugh (incumbent) | 138,322 | 74.3 | −4.7 | |
| Democratic | Neil P. Tallon | 42,698 | 22.9 | +1.9 | |
| Independence | Willard E. Smith | 5,167 | 2.8 | +2.8 | |
| Majority | 95,624 | 51.4 | −6.6 | ||
| Turnout | 186,187 | 100 | +26.1 | ||
| Party | Candidate | Votes | % | ±% | |
|---|---|---|---|---|---|
| Republican | Sherwood Boehlert | 108,017 | 70.7 | −3.6 | |
| Conservative | David L. Walrath | 32,991 | 21.6 | +21.6 | |
| Green | Mark Dunau | 6,660 | 4.4 | +4.4 | |
| Right to Life | Kathleen M. Peters | 5,109 | 3.3 | +3.3 | |
| Majority | 75,026 | 49.1 | −2.3 | ||
| Turnout | 152,777 | 100 | −17.9 | ||
| Party | Candidate | Votes | % | ±% | |
|---|---|---|---|---|---|
| Republican | Sherwood Boehlert (incumbent) | 143,000 | 56.9 | −13.8 | |
| Democratic | Jeff A. Miller | 85,140 | 33.9 | +33.9 | |
| Conservative | David L. Walrath | 23,228 | 9.2 | −12.4 | |
| Majority | 57,860 | 23.0 | −26.1 | ||
| Turnout | 251,368 | 100 | +64.5 | ||
In 2008, Michael Arcuri won the election with 130,799 votes (9,454 from Working Families Party line) to Richard L. Hanna's 120,880 out of 282,114 total votes. Note that in New York State electoral politics there are several minor parties at various points on the political spectrum. Certain parties will invariably endorse either the Republican or Democratic candidate for every office, hence the state electoral results contain both the party votes, and the final candidate votes (Listed as "Recap").
| Party | Candidate | Votes | % | ±% | |
|---|---|---|---|---|---|
| Democratic | Michael Arcuri | 109,686 | 53.9 | +20.0 | |
| Republican | Raymond Meier | 91,504 | 45.0 | −11.9 | |
| Libertarian | Mike Sylvia | 2,134 | 1.0 | +1.0 | |
| Majority | 18,182 | 8.9 | −14.1 | ||
| Turnout | 203,324 | 100 | −19.1 | ||
| Party | Candidate | Votes | % | ±% | |
|---|---|---|---|---|---|
| Republican | Richard L. Hanna | 96,686 | 52.9% | ||
| Democratic | Michael Arcuri (incumbent) | 86,037 | 47.1% | ||
| Turnout | 182,723 | 100 | |||
| Party | Candidate | Votes | % | ±% | |
|---|---|---|---|---|---|
| Democratic | Dan Maffei | 131,242 | 48.7 | −1.1 | |
| Republican | Ann Marie Buerkle | 116,641 | 43.3 | −6.9 | |
| Green | Ursula Rozum | 21,413 | 8.0 | +8.0 | |
| Majority | 14,601 | 5.4 | +5.0 | ||
| Turnout | 269,296 | 100 | +29.4 | ||
| Party | Candidate | Votes | % | ±% | |
|---|---|---|---|---|---|
| Republican | John Katko | 112,469 | 59.9 | +16.6 | |
| Democratic | Dan Maffei (incumbent) | 75,286 | 40.1 | −8.6 | |
| Majority | 37,183 | 19.8 | +14.4 | ||
| Turnout | 187,755 | 100 | −30.2 | ||
| Party | Candidate | Votes | % | ±% | |
|---|---|---|---|---|---|
| Republican | John Katko (incumbent) | 170,532 | 61.0 | +1.1 | |
| Democratic | Colleen Deacon | 108,928 | 39.0 | −1.1 | |
| Majority | 61,604 | 22.0 | +2.2 | ||
| Turnout | 279,460 | 100 | +48.8 | ||
| Party | Candidate | Votes | % | ±% | |
|---|---|---|---|---|---|
| Republican | John Katko (incumbent) | 136,920 | 52.6 | −8.4 | |
| Democratic | Dana Balter | 123,226 | 47.4 | +8.4 | |
| Majority | 13,694 | 5.2 | −16.8 | ||
| Turnout | 260,146 | 100 | −6.9 | ||
| Party | Candidate | Votes | % | |
|---|---|---|---|---|
| Republican | John Katko | 156,025 | 45.4 | |
| Conservative | John Katko | 21,062 | 6.1 | |
| Independence | John Katko | 5,480 | 1.6 | |
| Total | John Katko (incumbent) | 182,567 | 53.1 | |
| Democratic | Dana Balter | 147,638 | 43.0 | |
| Working Families | Steven Williams | 13,232 | 3.9 | |
| Total votes | 343,437 | 100.0 | ||
| Republican hold | ||||
Historical district boundaries

.tif.png.webp)
See also
References
- "My Congressional District".
- "2022 Cook PVI℠: District Map and List". Cook Political Report. Retrieved January 10, 2023.
- "2022 Cook PVI℠: District Map and List". Cook Political Report. Retrieved January 23, 2023.
- Martis, Kenneth C. (1989). The Historical Atlas of Political Parties in the United States Congress. New York: Macmillan Publishing Company.
- Martis, Kenneth C. (1982). The Historical Atlas of United States Congressional Districts. New York: Macmillan Publishing Company.
- Congressional Biographical Directory of the United States 1774–present
- 2004 House election data Clerk of the House of Representatives
- 2002 House election data "
- 2000 House election data "
- 1998 House election data "
- 1996 House election data "
- 1984 House election data "