Changshan County
 Changshan County (Chinese: 常山县; pinyin: Chángshān Xiàn) is a county under the jurisdiction of the prefecture-level city of Quzhou in the west of Zhejiang Province, People's Republic of China, bordering Jiangxi Province to the southwest. The district's total area is 1099 square kilometers, and its population is 320,000 people. The district's postal code is 324200. The district government is located at 29 Shengli Road, in the town of Tianma.
Changshan
常山县 | |
|---|---|
.jpg.webp) Renmin Road (人民路) in Changshan | |
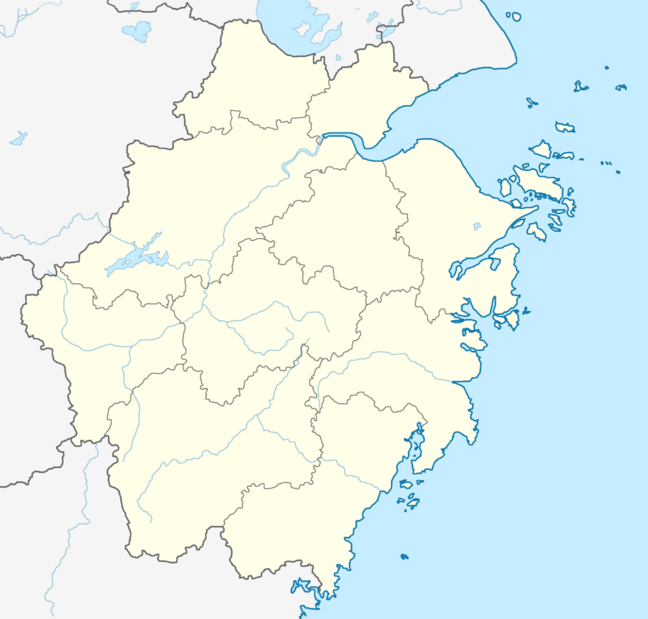  Changshan Location of the seat in Zhejiang | |
| Coordinates: 28°54′04″N 118°30′40″E | |
| Country | People's Republic of China |
| Province | Zhejiang |
| Prefecture-level city | Quzhou |
| Time zone | UTC+8 (China Standard) |
Administrative regions
The county administers seven towns, 14 rural villages, 11 residential areas, and 341 administrative villages.
Towns: Tianma, Zhaoxian, Huibu, Fangcun, Qiuchuan, Baishi, and Qingshi.
Rural villages: Hejia, Songfan, Donglu, Xinqiao, Jiarong, Xinchang, Jinyuan, Longrao, Tonggong, Qiankou, Daqiaotou, Wuli, Dong'an, and Gedi.
Climate
| Climate data for Changshan (1981−2010) | |||||||||||||
|---|---|---|---|---|---|---|---|---|---|---|---|---|---|
| Month | Jan | Feb | Mar | Apr | May | Jun | Jul | Aug | Sep | Oct | Nov | Dec | Year |
| Record high °C (°F) | 25.0 (77.0) |
28.8 (83.8) |
34.0 (93.2) |
34.8 (94.6) |
36.8 (98.2) |
37.9 (100.2) |
41.8 (107.2) |
40.8 (105.4) |
40.4 (104.7) |
36.5 (97.7) |
31.9 (89.4) |
24.6 (76.3) |
41.8 (107.2) |
| Average high °C (°F) | 9.8 (49.6) |
11.9 (53.4) |
15.9 (60.6) |
22.2 (72.0) |
27.1 (80.8) |
29.5 (85.1) |
34.0 (93.2) |
33.8 (92.8) |
29.7 (85.5) |
24.5 (76.1) |
18.6 (65.5) |
12.9 (55.2) |
22.5 (72.5) |
| Daily mean °C (°F) | 5.7 (42.3) |
7.6 (45.7) |
11.3 (52.3) |
17.2 (63.0) |
22.1 (71.8) |
25.1 (77.2) |
28.9 (84.0) |
28.5 (83.3) |
24.8 (76.6) |
19.6 (67.3) |
13.6 (56.5) |
7.8 (46.0) |
17.7 (63.8) |
| Average low °C (°F) | 2.6 (36.7) |
4.4 (39.9) |
7.8 (46.0) |
13.3 (55.9) |
18.0 (64.4) |
21.7 (71.1) |
24.7 (76.5) |
24.5 (76.1) |
21.1 (70.0) |
15.7 (60.3) |
9.6 (49.3) |
3.9 (39.0) |
13.9 (57.1) |
| Record low °C (°F) | −6.5 (20.3) |
−4.7 (23.5) |
−3.3 (26.1) |
2.9 (37.2) |
8.8 (47.8) |
13.3 (55.9) |
18.9 (66.0) |
18.2 (64.8) |
12.7 (54.9) |
3.8 (38.8) |
−1.8 (28.8) |
−7.8 (18.0) |
−7.8 (18.0) |
| Average precipitation mm (inches) | 87.5 (3.44) |
113.7 (4.48) |
199.5 (7.85) |
226.1 (8.90) |
233.9 (9.21) |
317.0 (12.48) |
186.0 (7.32) |
112.4 (4.43) |
85.6 (3.37) |
61.4 (2.42) |
81.2 (3.20) |
56.2 (2.21) |
1,760.5 (69.31) |
| Average relative humidity (%) | 77 | 77 | 78 | 77 | 77 | 80 | 75 | 75 | 75 | 72 | 74 | 73 | 76 |
| Source: China Meteorological Data Service Center[1] | |||||||||||||
References
- 中国地面气候标准值月值(1981-2010) (in Simplified Chinese). China Meteorological Data Service Center. Retrieved 5 November 2022.