Portal:Climate change

The Climate Change Portal Average surface air temperatures from 2011 to 2020 compared to the 1951-1980 average. Source: NASA. In common usage, climate change describes global warming—the ongoing increase in global average temperature—and its effects on Earth's climate system. Climate change in a broader sense also includes previous long-term changes to Earth's climate. The current rise in global average temperature is more rapid than previous changes, and is primarily caused by humans burning fossil fuels. Fossil fuel use, deforestation, and some agricultural and industrial practices increase greenhouse gases, notably carbon dioxide and methane. Greenhouse gases absorb some of the heat that the Earth radiates after it warms from sunlight. Larger amounts of these gases trap more heat in Earth's lower atmosphere, causing global warming. Due to climate change, deserts are expanding, while heat waves and wildfires are becoming more common. Increased warming in the Arctic has contributed to melting permafrost, glacial retreat and sea ice loss. Higher temperatures are also causing more intense storms, droughts, and other weather extremes. Rapid environmental change in mountains, coral reefs, and the Arctic is forcing many species to relocate or become extinct. Even if efforts to minimise future warming are successful, some effects will continue for centuries. These include ocean heating, ocean acidification and sea level rise. Climate change threatens people with food and water scarcity, increased flooding, extreme heat, more disease, and economic loss. Human migration and conflict can also be a result. The World Health Organization (WHO) calls climate change the greatest threat to global health in the 21st century. Communities may adapt to climate change through efforts like coastline protection or expanding access to air conditioning, but some impacts are unavoidable. Poorer countries are responsible for a small share of global emissions, yet they have the least ability to adapt and are most vulnerable to climate change. Many climate change impacts are already felt at the current 1.2 °C (2.2 °F) level of warming. Additional warming will increase these impacts and can trigger tipping points, such as the melting of the Greenland ice sheet. Under the 2015 Paris Agreement, nations collectively agreed to keep warming "well under 2 °C". However, with pledges made under the Agreement, global warming would still reach about 2.7 °C (4.9 °F) by the end of the century. Limiting warming to 1.5 °C will require halving emissions by 2030 and achieving net-zero emissions by 2050. Reducing emissions requires generating electricity from low-carbon sources rather than burning fossil fuels. This change includes phasing out coal and natural gas fired power plants, vastly increasing use of wind, solar, and other types of renewable energy, and reducing energy use. Electricity generated from non-carbon-emitting sources will need to replace fossil fuels for powering transportation, heating buildings, and operating industrial facilities. Carbon can also be removed from the atmosphere, for instance by increasing forest cover and by farming with methods that capture carbon in soil. (Full article...) Selected article – Global sea level rise from 1880 to 2015. Between 1901 and 2018, the globally averaged sea level rose by 15–25 cm (6–10 in), or 1–2 mm per year on average. This rate is accelerating, and sea levels are now rising by 3.7 mm (0.146 inches) per year. This is caused by human-induced climate change, as it continually heats (and therefore expands) the ocean and melts land-based ice sheets and glaciers. Between 1993 and 2018, the thermal expansion of water contributed 42% to sea level rise (SLR); melting of temperate glaciers, 21%; Greenland, 15%; and Antarctica, 8%. Because sea level rise lags changes in Earth temperature, it will continue to accelerate between now and 2050 purely in response to warming which has already occurred: whether it continues to accelerate after that is dependent on the human greenhouse gas emissions. Even if sea level rise does not accelerate, it will continue for a very long time: over the next 2000 years, it is projected to amount to 2–3 m (7–10 ft) if global warming is limited to 1.5 °C (2.7 °F), to 2–6 m (7–20 ft) if it peaks at 2 °C (3.6 °F) and to 19–22 metres (62–72 ft) if it peaks at 5 °C (9.0 °F). The rising seas pose both a direct risk of flooding unprotected areas and indirect threats of higher storm surges, king tides, and tsunamis. They are also associated with the detrimental second-order effects such as the loss of coastal ecosystems like mangroves, losses in crop production due to freshwater salinization of groundwater and irrigation water or the disruption of sea trade due to damaged ports. Globally, just the projected sea level rise by 2050 will expose places currently inhabited by tens of millions of people to annual flooding and this can increase to hundreds of millions in the latter decades of the century if greenhouse gas emissions are not reduced drastically. While modest increases in sea level are likely to be offset when cities adapt by constructing sea walls or through relocating people, many coastal areas have large population growth, which results in more people at risk from sea level rise. Later in the century, millions of people will be affected in cities such as Miami, Rio de Janeiro, Osaka and Shanghai under the warming of 3 °C (5.4 °F), which is close to the current trajectory. While the rise in sea levels ultimately impacts every coastal and island population on Earth, it does not occur uniformly due to local factors like tides, currents, storms, tectonic effects and land subsidence. Moreover, the differences in resilience and adaptive capacity of ecosystems, sectors, and countries again mean that the impacts will be highly variable. For instance, sea level rise along US coasts (and along the US East Coast in particular) is already higher than the global average, and it is expected to be 2 to 3 times greater than the global average by the end of the century. At the same time, Asia will be the region where sea level rise would impact the most people: eight Asian countries — Bangladesh, China, India, Indonesia, Japan, the Philippines, Thailand and Vietnam — account for 70% of the global population exposed to sea level rise and land subsidence. Altogether, out of the 20 countries with the greatest exposure to sea level rise, 12 are in Asia. Finally, the greatest near-term impact on human populations will occur in the low-lying Caribbean and Pacific islands — many of those would be rendered uninhabitable by sea level rise later this century. (Full article...)Selected picture –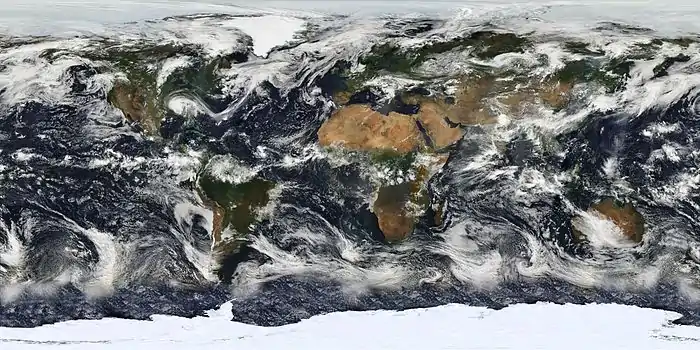 Image: Marit Jentoft-Nilsen, NASA An image of the Earth's cloud cover, which is the amount of sky obscured by clouds, based largely on observations from NASA's Moderate Resolution Imaging Spectroradiometer (MODIS) on board the Terra satellite. Clouds play multiple critical roles in the climate system. In particular, being bright objects in the visible part of sunlight, they efficiently reflect light to space and thus contribute to the cooling of the planet.
WikiProjects
In the news Additional News
Selected biography –
General imagesThe following are images from various climate-related articles on Wikipedia.
Did you know –Related portalsSelected panorama –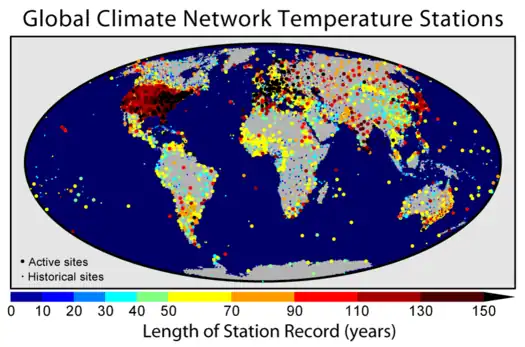 Credit: Created by Robert A. Rohde from data published by the U.S. NOAA Earth System Research Laboratory, Global Monitoring Division The Global Historical Climatology Network (GHCN) is one of the primary reference compilations of temperature data used for climatology, and is the foundation of the GISTEMP Temperature Record. This map shows the 7,280 fixed temperature stations in the GHCN catalog color coded by the length of the available record. Sites that are actively updated in the database (2,277) are marked as "active" and shown in large symbols, other sites are marked as "historical" and shown in small symbols. In some cases, the "historical" sites are still collecting data but due to reporting and data processing delays (of more than a decade in some cases) they do not contribute to current temperature estimates.
As is evident from this plot, the most densely instrumented portion of the globe is in the United States, while Antarctica is the most sparsely instrumented land area. Parts of the Pacific and other oceans are more isolated from fixed temperature stations, but this is supplemented by volunteer observing ships that record temperature information during their normal travels. This image shows 3,832 records longer than 50 years, 1,656 records longer than 100 years, and 226 records longer than 150 years. The longest record in the collection began in Berlin in 1701 and is still collected in the present day.
Topics
Categories Category puzzle Climate change Climate change by country and region Climate change-related lists Climate change assessment and attribution Climate change and the environment Climate change feedbacks Greenhouse gases Climate change litigation Climate change mitigation Climate change and society Climate change stubs Web resources
Things to do
WikimediaReferences
Discover Wikipedia using portals
| |||||||||||||||||||||||||||||||||||||||||||||||||||||||||||||||||||||||||||||||||||||||||||||||||||


.jpg.webp)


%252C_the_El_Ni%C3%B1o_%E2%80%93_Southern_Oscillation%252C_the_Arctic_Oscillation%252C_and_the_North_Atlantic_Oscillation_(NOAA).png.webp)


.png.webp)


.png.webp)